Tip: HDD and CDD indicators are better than Köppen–Geiger climate classification
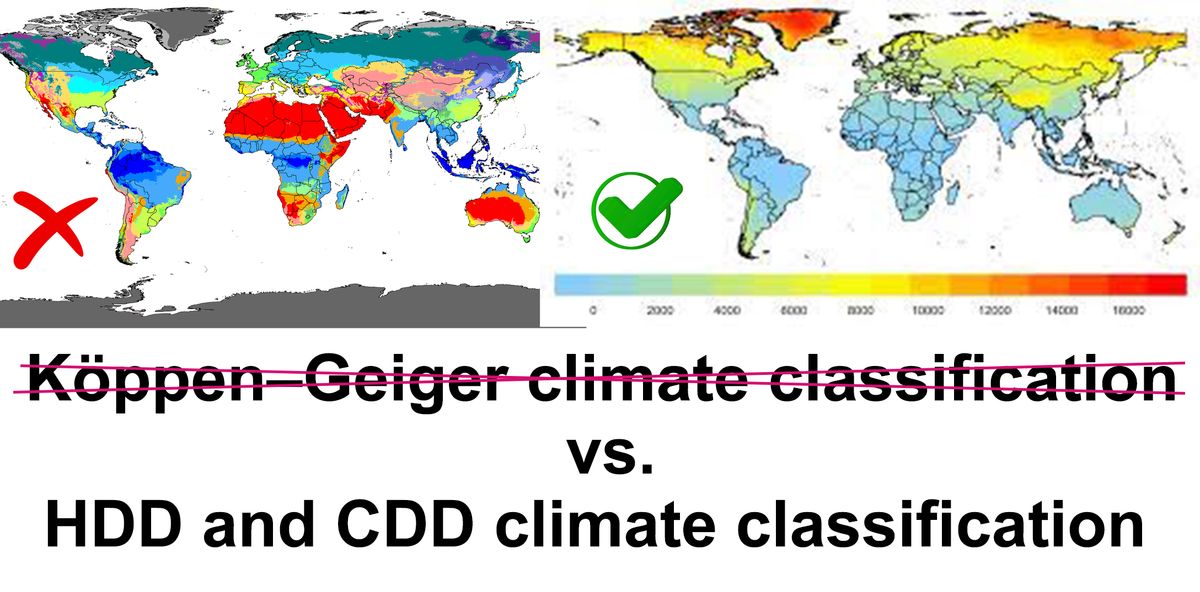
The Köppen-Geiger 🌡️climate classification is based on 🥬 ground cover vegetation, for which the 🌧️ rain is the most important parameter for clustering. It is not the best adapted to energy use evaluation in 🏬 buildings. I strongly recommend using HDD and CDD indicators and future weather 📂 files to better (more accurately) 🔣 characterize the 🌡️ climate and enable 🌡️ climate-proof design.
📣 Read and share the 📄 tip: https://lnkd.in/edncD6jQ
Thank you, Dru Crawley, Pablo La Roche, and Mohamed Hamdy, for your inspiration.
Subscribe to my mailing list: www.shadyattia.org
Look at my ☑️ recent posts' activities. https://lnkd.in/eR-jiXtR
#future #weatherdata #climateclassification #energysimulation #climateproof #design #decisionsupport #climateanalysis
Under climate change, there is a need for an accurate and future-sensitive climate classification based on robust indices from high-resolution future weather projection files. Architects, building engineers, and urban planners are using the Köppen–Geiger climate classification system in their daily practice to characterize. The Köppen–Geiger climate classification is adapted to vegetation for which the rain is most important. It may not be best adapted to energy use in buildings.
The Köppen climate classification is one of the most widely used international systems. It was first published by German-Russian climatologist Wladimir Köppen (1846–1940) in 1884, with several later modifications by Köppen, notably in 1918 and 1936. Later, the climatologist Rudolf Geiger (1894–1981) introduced some changes to the classification system, which is thus sometimes called the Köppen–Geiger climate classification system. However, the Köppen–Geiger climate classification system is mainly based on ground coverage and precipitation, which makes it unfit for bioclimatic design and building energy performance analysis.
Therefore, it is strongly recommended to abandon the Köppen–Geiger climate classification system and use the Cooling Degree-days (CDD) and Heating Degree-days (HDD) meteorological indices defined as integrated temperature deviations from a base temperature over time. ASHRAE standard 169 or 90.1 can be a good basis to classify and compare the climate based on this method. Formally, degree days are defined as a summation of the differences between the outdoor temperature and some threshold (or reference base) temperature over a specified period (such as at annual time scales).
Put simply, a Cooling Degree-day is an outdoor temperature below which a building would not require cooling. Conversely, a Heating Degree-day is the outdoor temperature above which a building would not require heating. A key issue in the application of degree days is the definition of the reference base temperature, which should ideally differentiate the region-specific thermal factor. For instance, a widely used common base temperature of 18.3 ˚C (65 ˚F) for computing degree-days over Texas (USA) and Siberia (Russia) may not account for the underlying heterogeneous mean climate in the two regions, wherein the residents would have adapted to the differential thermal comfort level. As the choice of base temperature can be subjective and through statistical reasoning, defining an appropriate region-specific threshold often creates a dilemma, especially in large countries with diverse temperature ranges (such as the United States of America, India, and China).
References
[1]Day, T. Degree-days: Theory and Application [Butcher, K. (ed.)] [1–98] (The Chartered Institution of Building Services Engineers, London, 2006).
[2]https://en.wikipedia.org/wiki/Beijing and https://en.wikipedia.org/wiki/Philadelphia
[3]Scott, M. J. & Huang, Y. J. [Effects of Climate Change on Energy Use in the United States] Effects of Climate Change on Energy Production and Use in the United States [7–28] (CCSP, Washington, 2008).
[4]Collins, M. et al. [Long-term Climate Change: Projections, Commitments, and Irreversibility] Climate Change 2013: The Physical Science Basis. Contribution of Working Group I to the Fifth Assessment Report of the Intergovernmental Panel on Climate Change. [Stocker, T. F. et al. (ed.)]. [1029–1136] (Cambridge University Press, Cambridge, 2013).
[5]Rodell, M. et al. [The Global Land Data Assimilation System (GLDAS)], (Bulletin of the American Meteorological Society 85: 381-394, 2004).
[6]Climate Data Operators (CDO): http://www.mpimet.mpg.de/cdo
[7] Mistry, M. (2018) Cooling Degree days and Heating degree days, http://www.energy-a.eu/cooling-degree-days-and-heating-degree-days/
----------------------------------------------------------------------------------------------—